cznolan
Cisco Streaming Telemetry with Telegraf, InfluxDB, Grafana (TIG)
by cznolan
For this guide I wanted to take a look at receiving telemetry data from IOS XE, IOS XR, and NX-OS devices, in order to visualise some basic information. I have chosen to use YANG data models to collect the data, gRPC without TLS for transport, with kvGPB-encoded data transmitted to the receiver.
The end result is going to be a fairly bare-bones telemetry solution, which could be improved upon in various ways such as enabling TLS encryption on various services, or filtering specific telemetry data from being stored in the database. I have left a lot of this out in order to focus on the basics of what is required to collect, receive, and visualise telemetry data.
Telemetry Receiver Setup
The telemetry receiver will just be a Linux server with a few pieces of software installed. I have opted to use CentOS 8 for this guide.
- InfluxDB will be used to store all of the telemetry data received from devices.
- Telegraf will listen for the telemetry data and write it to the InfluxDB database.
- Grafana will be used to visualise the telemetry data stored in the InfluxDB database.
Receiver Basic Config
It is critical that the system clock is accurate on the telemetry receiver and devices. I have setup NTP on my CentOS server during installation, so all I am going to do before getting started is correct any clock drift and update all the installed packages.
sudo chronyc makestep
sudo dnf upgrade
InfluxDB Config
As per the instructions on the InfluxDB website at the link below, we first want to add the InfluxData repository so that we can easily install InfluxDB.
https://docs.influxdata.com/influxdb/v1.7/introduction/installation/
cat <<EOF | sudo tee /etc/yum.repos.d/influxdb.repo
[influxdb]
name = InfluxDB Repository - RHEL \$releasever
baseurl = https://repos.influxdata.com/rhel/\$releasever/\$basearch/stable
enabled = 1
gpgcheck = 1
gpgkey = https://repos.influxdata.com/influxdb.key
EOF
We can then download the metadata from the repository and install InfluxDB.
sudo dnf makecache
sudo dnf install influxdb
Once installed, InfluxDB can be started and we can open TCP port 8086 in order to access the database.
sudo systemctl enable --now influxdb

sudo firewall-cmd --add-port=8086/tcp --permanent
sudo firewall-cmd --reload
With InfluxDB enabled, we can configure a database, data retention policy, and database credentials.
influx
> create database telegraf
> create retention policy "three_months_only" on telegraf duration 13w replication 1 default
> create user telegraf with password 'metrics'
InfluxDB Troubleshooting
The following are useful commands for basic troubleshooting of Telegraf.
- rpm -qi influxdb to verify InfluxDB is installed and the version.
- sudo dnf makecache to download the metadata from the InfluxData repository.
- systemctl status influxdb to check the status of the InfluxDB service.
- sudo systemctl restart influxdb to restart the InfluxDB service.
Once you have Telegraf setup, you can also explore the content in the database to see if it is what you expect.
We can quite easily check the retention policy, what measurements are being collected, and drill down into those measurements. Each measurement holds a timestamp in UNIX Epoch time, which you can check to make sure your telemetry data time stamps are accurate.
influx
> show retention policies on telegraf
> use telegraf
> show measurements
> select * from "Cisco-IOS-XE-process-cpu-oper:cpu-usage/cpu-utilization"
Telegraf Config
The previously configured InfluxData repository was also required to install Telegraf, so we can simply go ahead and install the application as we have added the repository and downloaded the metadata already.
sudo dnf install telegraf
Once installed the configuration of the application will be done in the /etc/telegraf/telegraf.conf file. Edit this file with your preferred text editor and edit the below key entries as required.
[[inputs.cisco_telemetry_mdt]]
 transport = "grpc"
 service_address = ":57000"

[[outputs.influxdb]]
  database = "telegraf"
  urls = [ "http://127.0.0.1:8086" ]
  username = "telegraf"
  password = "metrics"
Once configured, enable telegraf as a service and open up the TCP port configured in the file above.
sudo systemctl enable --now telegraf

sudo firewall-cmd --add-port=57000/tcp --permanent
sudo firewall-cmd --reload
Telegraf should now be able to collect telemetry data and write it to the InfluxDB database.
Telegraf Troubleshooting
The following are useful commands for basic troubleshooting of Telegraf.
- rpm -qi telegraf to verify Telegraf is installed and the version.
- sudo dnf makecache to download the metadata from the InfluxData repository.
- systemctl status telegraf to check the status of the Telegraf service.
- sudo systemctl restart telegraf to restart the Telegraf service. Required if you have made changes to the configuration file.
- telegraf --test to verify the configuration in the telegraf.conf file is correct.
Grafana Config
As per the instructions on the Grafana website at the link below, we first want to add the Grafana repository so that we can easily install Grafana.
https://grafana.com/docs/grafana/latest/installation/rpm/
cat <<EOF | sudo tee /etc/yum.repos.d/grafana.repo
[grafana]
name=grafana
baseurl=https://packages.grafana.com/oss/rpm
repo_gpgcheck=1
enabled=1
gpgcheck=1
gpgkey=https://packages.grafana.com/gpg.key
sslverify=1
sslcacert=/etc/pki/tls/certs/ca-bundle.crt
EOF
We can then download the metadata from the repository and install Grafana.
sudo dnf makecache
sudo dnf install grafana
If you wish to edit the Grafana configuration you can do so in the /etc/grafana/grafana.ini configuration file. In this example I am going to leave the Grafana configuration as default and simply start the service and listen for HTTP on the default TCP port of 3000.
sudo systemctl enable --now grafana-server.service

sudo firewall-cmd --add-port=3000/tcp --permanent
sudo firewall-cmd --reload
You can then browse to the Grafana web interface, for example http://grafana.example:3000/
Grafana Troubleshooting
The following are useful commands for basic troubleshooting of Grafana.
- rpm -qi grafana to verify Grafana is installed and the version.
- sudo dnf makecache to download the metadata from the Grafana repository.
- systemctl status grafana-server.service to check the status of the Grafana service.
- sudo systemctl restart grafana-server.service to restart the Grafana service. Required if you have made changes to the configuration file.
Device Config
Much like the telemetry receiver, the devices sending telemetry must have accurate clocks. You should make sure all your devices have the correct timezone, clock/date, and NTP configuration before configuring telemetry.
The sensor paths configured on each platform can be derived from the YANG models published in this Cisco GitHub repository.
https://github.com/YangModels/yang/tree/master/vendor/cisco
The sensor path can be as specific as you like. For the module process-cpu-ios-xe-oper, you could drill down into the container cpu-usage, then cpu-utilization to collect several CPU statistics such as 5 second average, 1 minute average, 5 minute average etc. Or, you could specify the one-minute leaf object to only collect the 1 minute average. This would be represented by the below two examples on IOS XE.
filter xpath /process-cpu-ios-xe-oper:cpu-usage/cpu-utilization
filter xpath /process-cpu-ios-xe-oper:cpu-usage/cpu-utilization/one-minute
There is a YANG Explorer application that may be useful, however as it is unmaintained I have not bothered to test it.
https://github.com/CiscoDevNet/yang-explorer
IOS XE
In IOS XE the YANG models need to be initialised, and from there telemetry subscriptions can be configured. Each subscription can only be configured with a single sensor path, so multiple subscriptions will be required to collect a diverse set of telemetry data.
Updates can be made on-change, or periodically. Periodic updates are defined in 10ms intervals, so the below configured period of 500 is equal to 5000ms.
The configuration was performed on a CSR1000v appliance running IOS XE 16.12.4a
netconf-yang

telemetry ietf subscription 1
 encoding encode-kvgpb
 filter xpath /process-cpu-ios-xe-oper:cpu-usage/cpu-utilization
 source-address 192.0.2.10
 stream yang-push
 update-policy periodic 500
 receiver ip address 192.0.2.1 57000 protocol grpc-tcp
IOS XE Troubleshooting
There are a few useful commands to troubleshoot Telemetry configuration on IOS XE.
- show platform software yang-management process will show whether the YANG processes are running.
- show telemetry ietf subscription 1 detail will show the configuration of the given subscription and whether it is valid.
- show telemetry ietf subscription 1 receiver will show if the device has connected to the telemetry receiver for the given subscription.
IOS XR
In IOS XR telemetry is included in the base image, and no special configuration is required to get started. The sensor group can be configured with multiple sensor paths.
The configuration was performed on an IOS XRv 9000 appliance running IOS XR 7.0.1
telemetry model-driven
 destination-group LAB-SERVER
  address-family ipv4 192.0.2.1 port 57000
   encoding self-describing-gpb
   protocol grpc no-tls
  !
 !
 sensor-group SENSOR-01
  sensor-path Cisco-IOS-XR-wdsysmon-fd-oper:system-monitoring/cpu-utilization
 !
 subscription SUB-01
  sensor-group-id SENSOR-01 sample-interval 5000
  destination-id LAB-SERVER
 !
!
IOS XR Troubleshooting
There are a few useful commands to troubleshoot Telemetry configuration on IOS XR.
- show telemetry model-driven sensor-group SENSOR-01 will show the configuration of the given sensor and whether it is valid.
- show telemetry model-driven subscription SUB-01 will show the configuration of the given subscription and whether it is valid.
- show telemetry model-driven destination LAB-SERVER will show if the device has connected to the telemetry receiver and various statistics.
NX-OS
In NX-OS the telemetry feature first needs to be initialised. The sensor group can be configured with multiple sensor paths.
The configuration was performed on a Nexus 9300v appliance running NX-OS 9.3.5
feature telemetry

telemetry
  destination-group LAB-SERVER
    ip address 192.0.2.1 port 57000 protocol gRPC encoding GPB
    use-vrf default
  sensor-group SENSOR-GROUP
    data-source YANG
    path Cisco-NX-OS-device:System/procsys-items/sysload-items/loadAverage1m
  subscription 1
    dst-grp LAB-SERVER
    snsr-grp SENSOR-GROUP sample-interval 5000
NX-OS Troubleshooting
There are a few useful commands to troubleshoot Telemetry configuration on NX-OS.
- show telemetry control database <options> has various options to verify sensor, receiver/destination, and subscription status.
- show feature | egrep telemetry will show whether the telemetry feature is enabled.
- show telemetry transport will show if the device has connected to the telemetry receiver for all subscriptions.
- show telemetry data collector details will show whether data has been collected successfully for all configured sensor paths.
In the YangModels GitHub repository you will find the exhaustive list of telemetry data that can be collect in the Cisco-NX-OS-device module for the given NX-OS version. On the device running NX-OS the show telemetry yang direct-path cisco-nxos-device command can be used to see some of the basic sensor paths that can be configured.
Grafana Visualisation
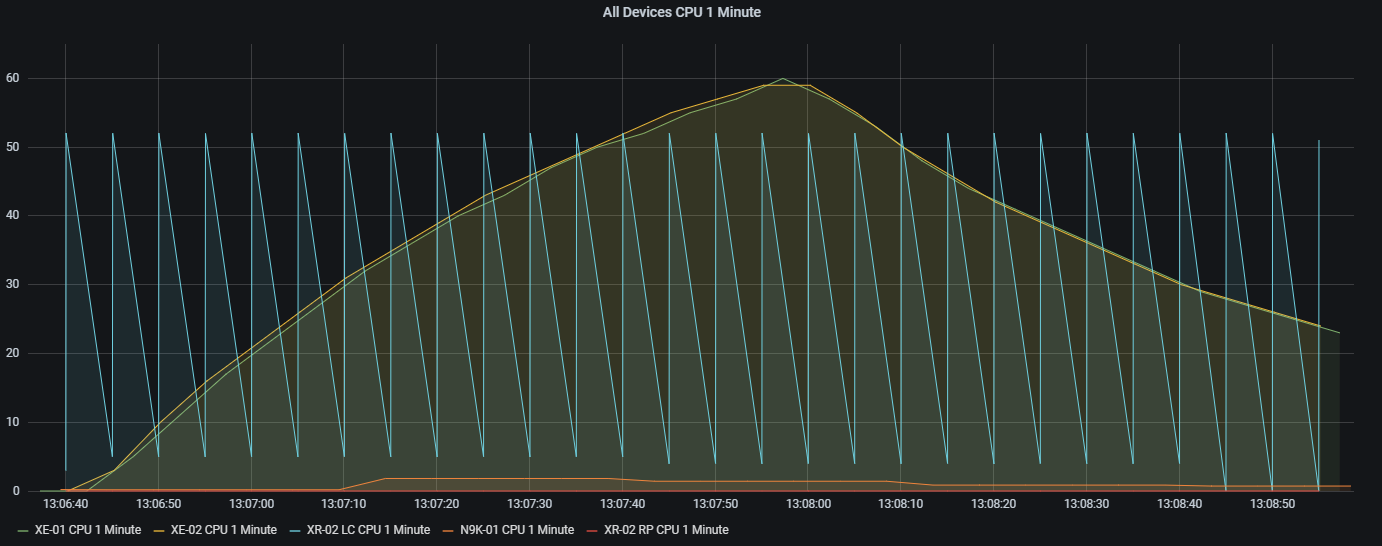
Below are a couple of examples of what I was able to visualise in Grafana. Because this was all configured on virtual appliances I opted to just test with CPU utilisation as it was easy enough for me to generate some traffic with debug ip packet enabled on each device. The results seen in the graphs correspond to what is seen on the device. For example, checking the line card CPU on the IOS XRv 9000 appliance shows it running at 51% constantly.
This was my first test with a couple of CSR1000v appliances.
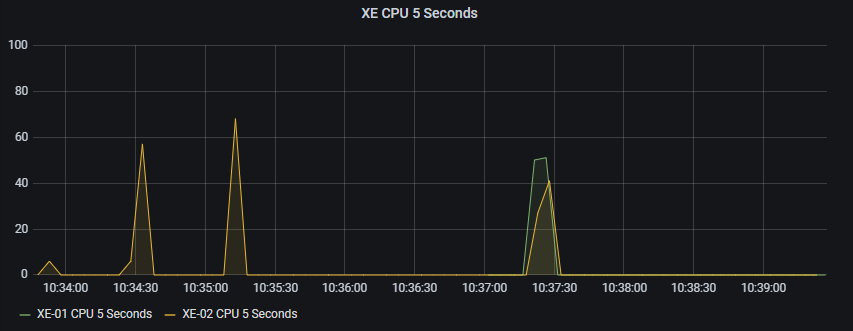
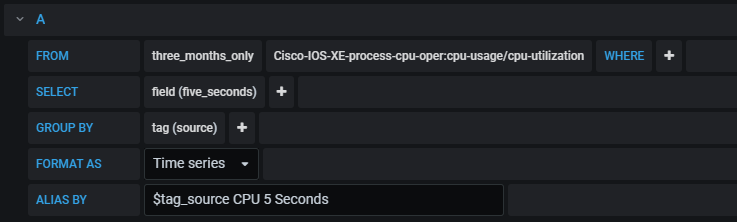
The query I created in Grafana was as follows.
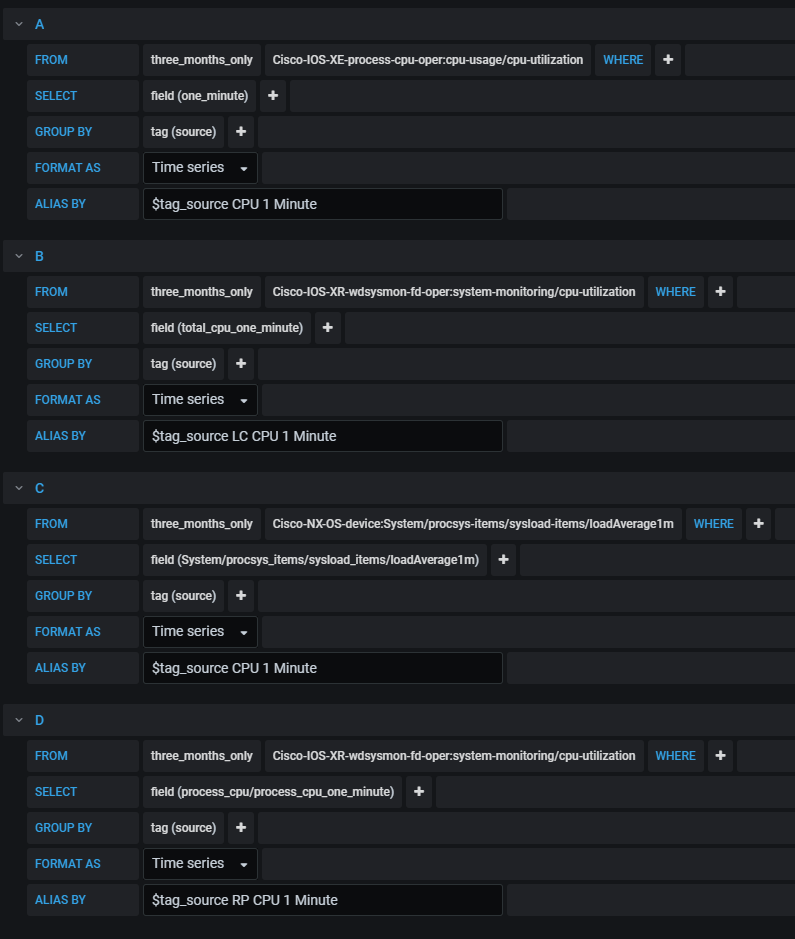
After playing around with the Nexus 9300v and IOS XRv 9000 appliances I also added them into a graph.
The query I created in Grafana was as follows.